How much will I generate from Solar PV?
How much will your solar array generate each day or year?
This is one of those questions that we have to say ‘depends’ to. When you get a quotation and design for Solar, you’ll get an ‘Estimated Annual Generation’ figure. This figure is calculated by using a method approved by the government, that all solar installers should use. This means the estimated generation you see should not fluctuate too much between installer quotations.
It is calculated by using an ‘Irradiance’ Chart which is set figures of how much could be generated per kWp depending on three factors:
- Location of the property (down the South of the UK would be higher than North)
- The orientation to South of the installation space
- The angle of the installation space (i.e. 30 degree roof pitch)
There is also an allowance made for and potential shading of the Solar Panels, such as from a chimney or nearby trees.
All together, this gives us a figure that indicates how much generation the Solar Array could produce. Could being the optimum word here, because as much as we’d love to give you a definitive figure, there is no way of predicting the sun!
However, in our experience, the estimated generation figures are pretty close. Here are just 3 examples from our clients generation figures.
| Size of System | Estimated Annual Generation | True Annual Generation (2023) |
|---|---|---|
| 9.24kWp | 6,755kWh | 6,980kWh |
| 6.8kWp | 5,242kWh | 5,393kWh |
| 5.1kWp | 5,115kWh | 5,063kWh |
You can see from the size of systems that this is not a clear indicator of generation, sometimes there are enough factors that mean a larger kW still generates similar figures to one smaller.
Let’s talk about curves
Solar is more effective the stronger the suns rays, that means during winter days when the sun is lower in the sky and weaker, the generation will be smaller. And likewise when the summer sun, high in the sky and brighter for longer, generation will be higher.
This creates the generation curve, and why understanding this and how to use the energy generated is essential for highest savings. All systems will reach peaks in the summer, and troughs in the winter.
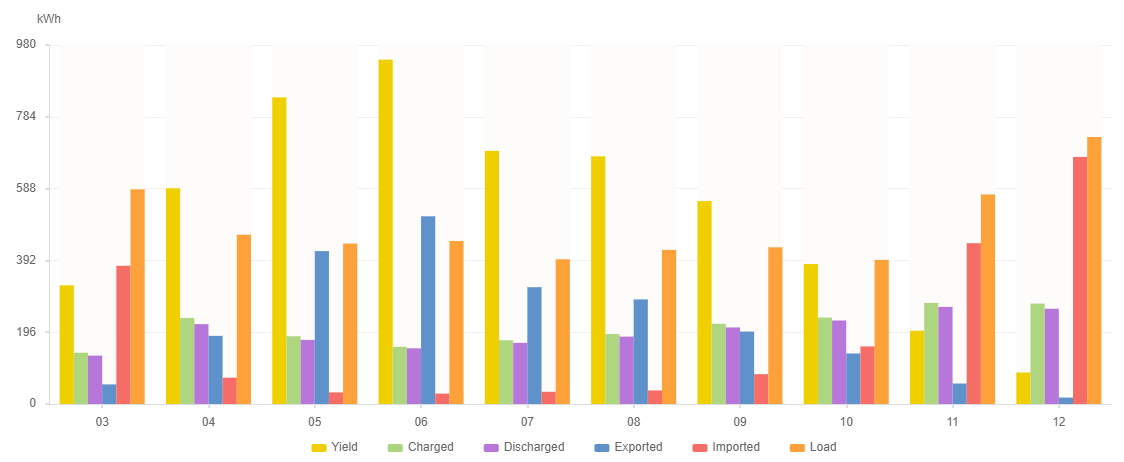
You can see from the example chart below, the yellow columns being the energy generated, that this lowers in the winter, peaking in the summer months. Interesting, you can also see how the amount of energy we use in our homes also changes over the year, with more needed during the winter (the orange columns).

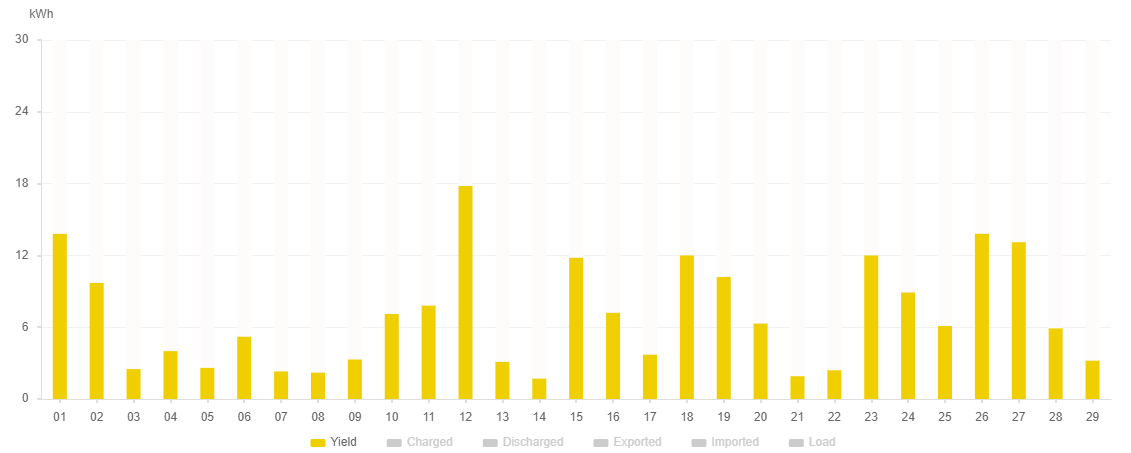
Interestingly, Winter time often means more fluctuations too. On a bright winter days you could generate a high amount, yet the very next day it rains and is miserable, reducing the generation to barely a flicker.
You can see in this chart from February 2024 how the days can change dramatically.

Although knowing how much could be generated from a solar PV installation is important, a figure to work from, true savings comes from ensuring the generation is used efficiently.
On average, around 30-50% of the generation is used by homeowners, the balance exported.
You can see from the chart from February that there are a few good days, these days would have exported to the grid, but with a little management you could use this energy differently. Perhaps by doing extra washing loads, batch cooking, using the tumble dryer.


